
Fig. 1: Geological map of Ireland.
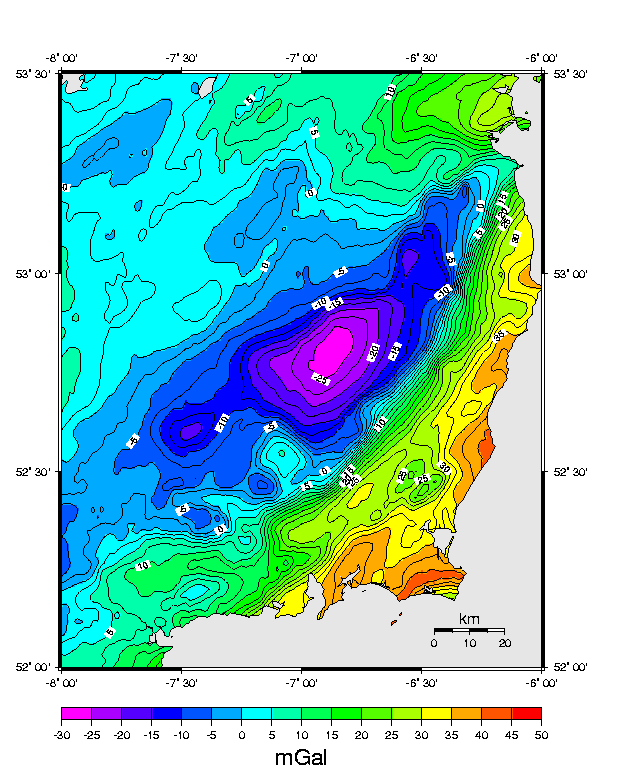
Fig. 2: Bouguer anomaly map.
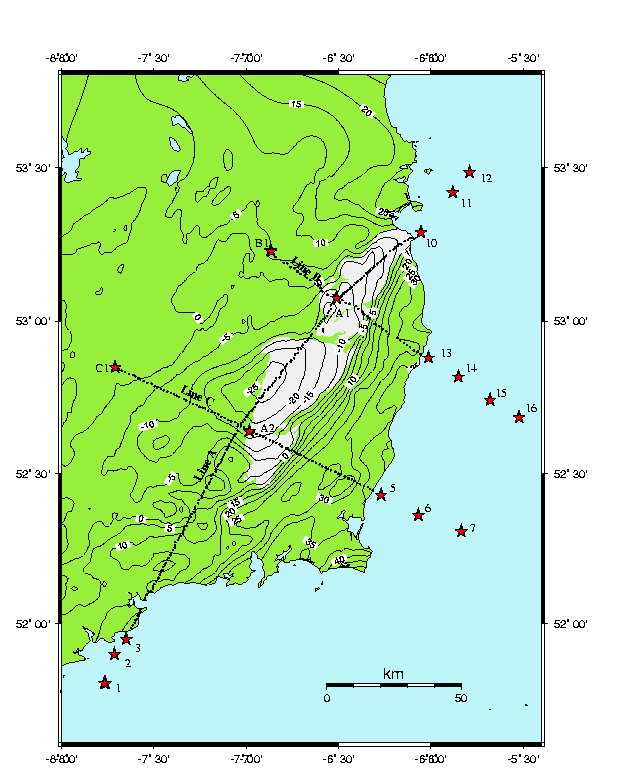
Fig. 3: Experimental layout of seismic lines and shots across the northern and southern (Tullow) plutons.
Shot 3: This was the southern shot at the end of line A. First arrivals Ps and Pg, have strong amplitudes with high signal-to-noise, but disappear after 60 km. Ps increases in velocity from 5.2 km/s to 5.5 km/s, while Pg begins fast at 6.0 km/s before slowing at 30 km, then speeds up after 50 km. Beyond Pg strong, secondary phases generated from interfaces in the upper and mid-crust, are observed, as is PmP, seen from an offset of 95 km to 140 km, although Pn is less clear.
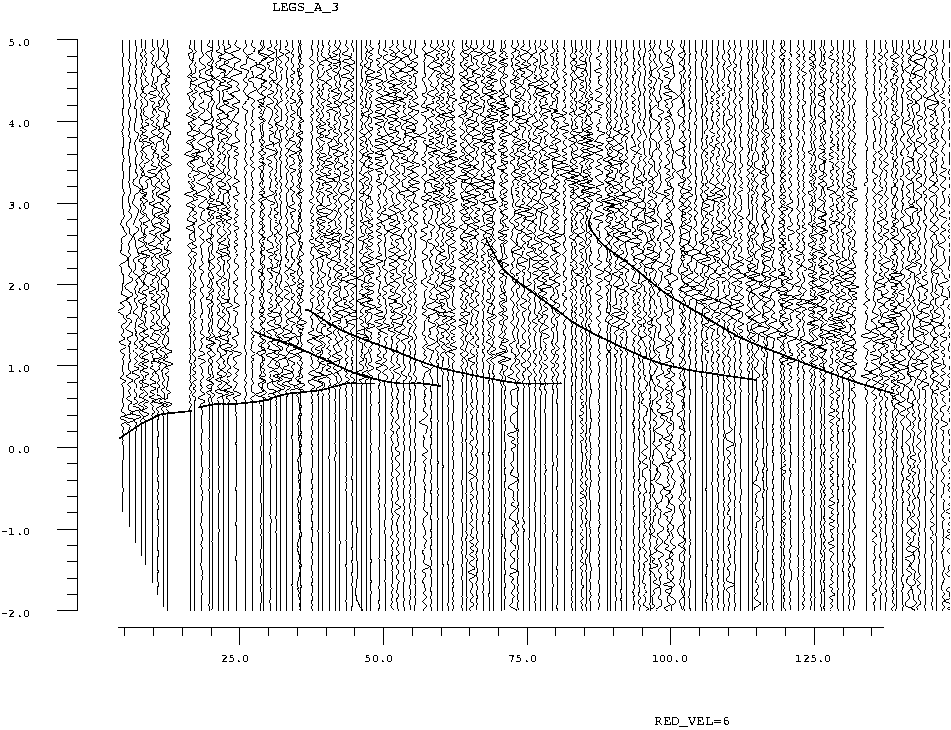
Fig. 4: Shot 3. Sea shot from southern end of line A.
Shot 10: This was fired in Dublin Bay at the northern end of line A. High velocities are seen early with Pg reaching a velocity of 6.0 km/s at an offset of -15 km before slowing slightly at -25 km, then returns back to a velocity of 6.0 km/s, possibly implying a thicken ing then thinning of the granite. Pg ends sharply at -46 km offset, when a step in the phases is seen, with Pg at 6.0 km/s increasing to 6.2 to 6.3 km/s. This suggest a steep gradient, which coincides with the transition from the granite into higher velocity volcanics. At an offset of -56 km phases slow again on re-entry into the granite. Pg arrivals eventually die out at -90 km, where a change in amplitude is also observed. A high amount of energy is returned between -10 and -35 km offsets, corresponding to reflections from the granite at about 4.0-4.5 km depth. There are several strong secondary phases, with a clear PmP phase. A high gradient Pn is seen with some kind of transition zone at the base of the crust.
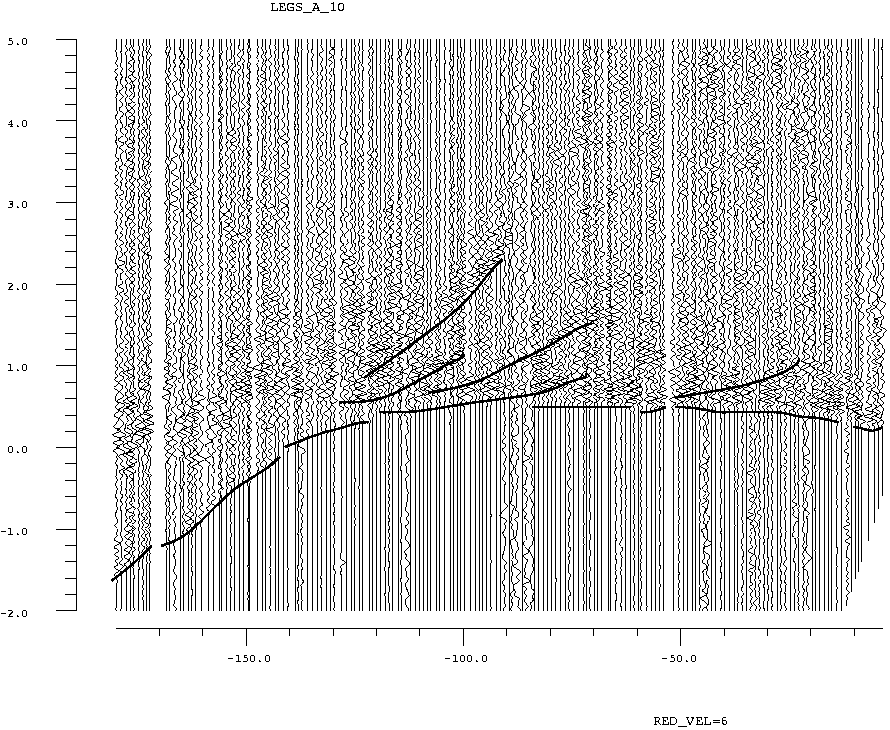
Fig. 5: Shot 10. Sea shot from northern end of line A.
Shot 13: This was the eastern sea shot on line B, with good signal-to- noise ratio. Pg arrivals begin fast before slowing to ~5.7 km/s at 10 km, then increase to about 6.0 km/s. A sharp step is seen at -25 km offset as velocities increase dramatically, before levelling off at 6.0 km/s, relating to where dense metasediments bound the granite on its eastern edge. Few reflections are observed and the section is too short for PmP or Pn to be recorded.
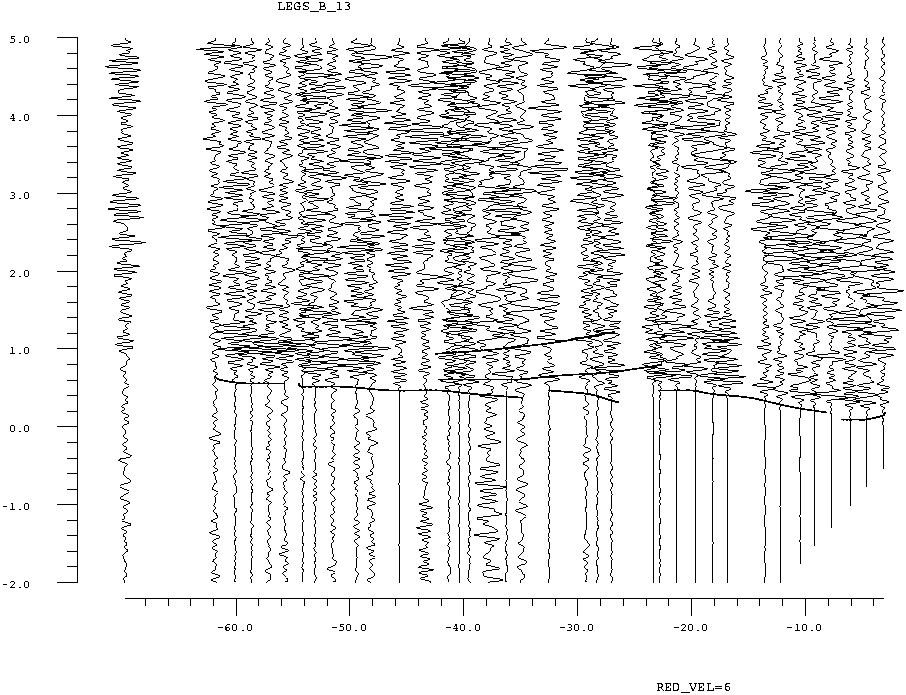
Fig. 6: Shot 13. Sea shot from eastern end of line B.
Shot 5: This was the eastern sea shot on line C, with good signal-to-noise. Pg begins fast over the first 8 km, then slow to around 5.8 km/s over the next ~25 km. At -36 km offset a slight step in phases is seen, with velocities increasing to ~6.1 km/s, implying a steepish gradient, correlating with the transition from Ordovician metasediments into the granite. A strong amplitude change is witnessed at -68 km offset, perhaps indicating a change from granite to country rock at depth. Faint shallow reflections are seen around -35 to -55 km offset, with PmP recorded from -90 km onwards.
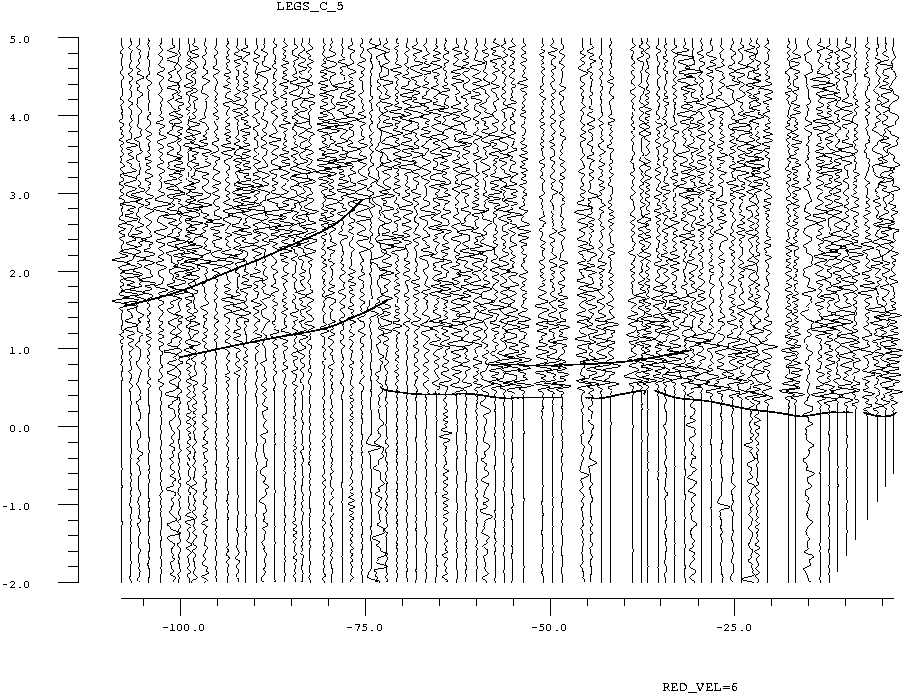
Fig. 7: Shot 5. Sea shot from eastern end of line C.
Line A is dominated by two bodies interpreted as granite, exhibiting internal layering at about 1.5 and 2.5 km depth, with velocity increasing from 5.3 km/s at the surface to around 5.9 km/s near 5 km depth. The northern granite reaches a depth of 4.0-4.5 km, thinning towards the northern coast, while the southern granite extends to about 5 km, with a degree of subsurface extension to the south. A series of near horizontal sedimentary layers exist to the south of the granites, which tend to rise towards and below the granite bodies, and show a degree of lateral velocity variations.
In the south, a zone of slower material is seen at around 40 km, which quickly changes to a high velocity zone of around 6.0 km/s near to the surface at 70 km. A high velocity zone separates the two granite bodies at about 135 km, with velocities up to 5.7 km/s at the surface.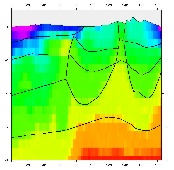

Fig. 8: Velocity model: line A.
Line B shows a series of layers rising towards the central layered granite body, with a similar velocity structure as line A. A rise in velocity is seen on the eastern edge of the granite body.
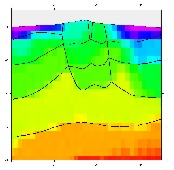
Fig. 9: Velocity model: line B.
Line C shows a similar pattern to that of lines A and B. A layered central body with velocities ranging from ~5.3 to 5.9 km/s is wedged between rising horizontal layers. A slight velocity rise is seen at depth at the western edge of the granite body.
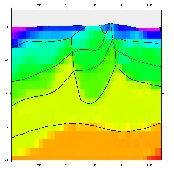
Fig. 10: Velocity model: line C.